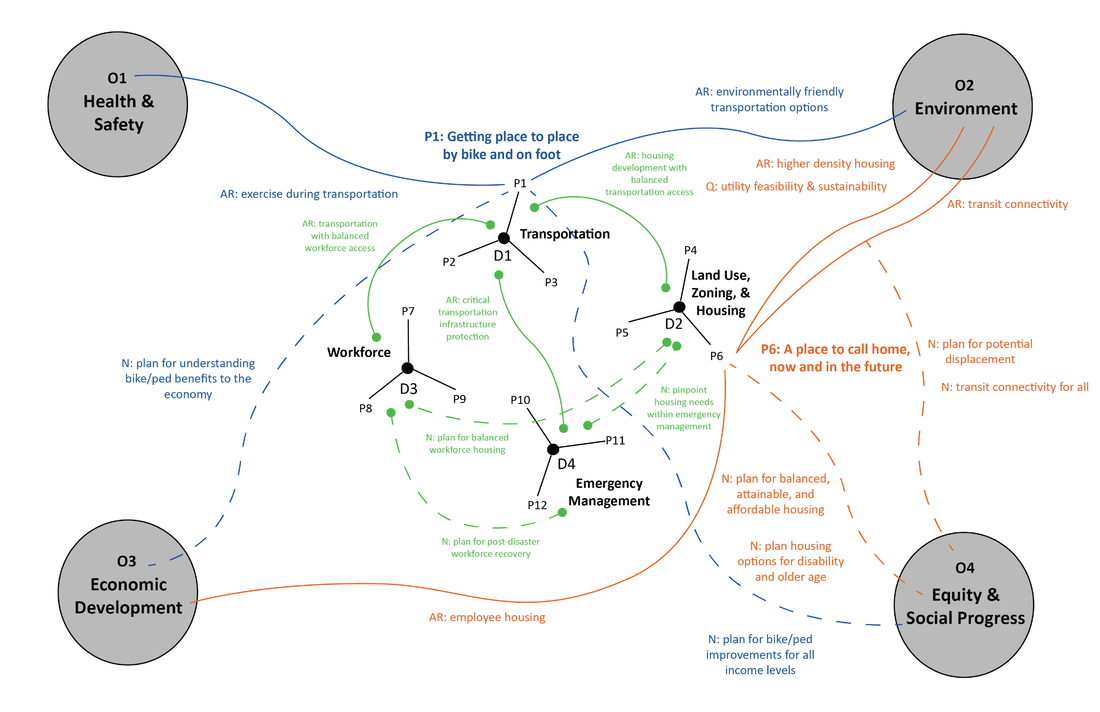
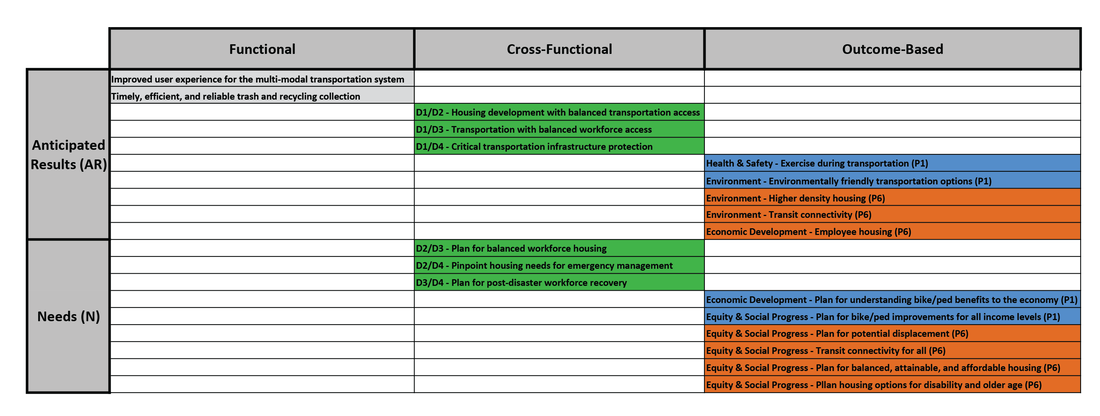
Civic Sphere
  • Home
  • Projects
    • Accessible Transportation
    • Service Models
    • Tech Maximization
    • New Concepts
  • Clients & Partners
  • About

Articles

July 30, 2018

7/30/2018


How to Map for Outcomes

Mind mapping can help you create a visual depiction of interconnections, to extract from your brain how you see concepts and subjects connect."
Picture
Why Urban Management Silos Exist covers the basics of silos. But what can be done about silos, or if not the silos themselves, then “siloed thinking?” The opposite of siloed thinking is 360 Degree Planning which means the professional looks at all angles to understand interconnectivity and interdependency, not only for a deeper level of understanding, but also to seed future actions taking this information into account.

Let’s say you are on the executive team or head of a division or department of your organization. Departments and divisions tend to be labeled according to their subject area, such as transportation, emergency management, and others. If you are on the executive team and oversee work across many different departments, it could be that lately you’ve realized you are not easily able to communicate the “why” of the organization. You know it contributes to outcomes such as economic development, equity and social progress, health and safety, and environment, but you are not sure how exactly. How can you present the organization’s work in such a way it resonates with the audience and rises above the basics? Perhaps eventually, you even want to be able to measure programs according to various outcomes, such as those listed above. It could also be that the organization is considering focusing its work more on a specific outcome, take equity and social progress for example, and you’d like to see the current status and reveal some initial gaps. Mapping this out is a great place to begin. Note that you can read more about this application of the term “outcomes” in How to Combine Mapping and Results for Holistic Organizations.
 
Why mind mapping?
Mind mapping can help you create a visual depiction of interconnections, to extract from your brain how you see concepts and subjects connect. Further, in most cases for urban management, multiple professionals need to work together and agree on how things work and what to do to make them better. Mind mapping as a group can be an amazing way to illustrate what everyone thinks, and how it paints a full picture. Keep in mind, the examples in this and other articles are fairly simplistic intentionally to show the process without getting too “into the weeds.” They are kept general for a wide audience; it is your experience and your mind map that will show you how you see reality.
 
Whatever the reason, mind mapping is a great place to start pinpointing connections. In order to mind map, you only need a pen, paper, and your thinking cap. There are a number of mind mapping software options out there, which a quick online search will reveal. For now, I’ll cover the basics completed by hand. Let’s get mapping!

Mind mapping for outcomes step-by-step
First, you’ll start off with the current basis of the organization, typically the departments or divisions of the organization. You’ll map these fairly equidistant from each other to give space around each one. Second, you’ll branch from the departments or divisions with the work they produce (see Figure A, D = department, P = Program). There is a wide variety, of course, but typically these are structured as programs (containing multiple projects and initiatives). Note that projects are likely at too small a scale to map with this step, unless they have an importance level similar to a program.  
Picture
Figure A
​Third, you’ll map out the outcomes of focus or interest. These will be to the left and right of the main map to give them some space (see Figure B, O = Outcome). Make copies of the map at this point, if working by hand. You’ll want one copy for each program or initiative. If working in a software program, you’ll want to create a layer for each program or initiative with its name identified for tracking purposes. I’m using a graphics program, so that the images are as clear as possible. 
Picture
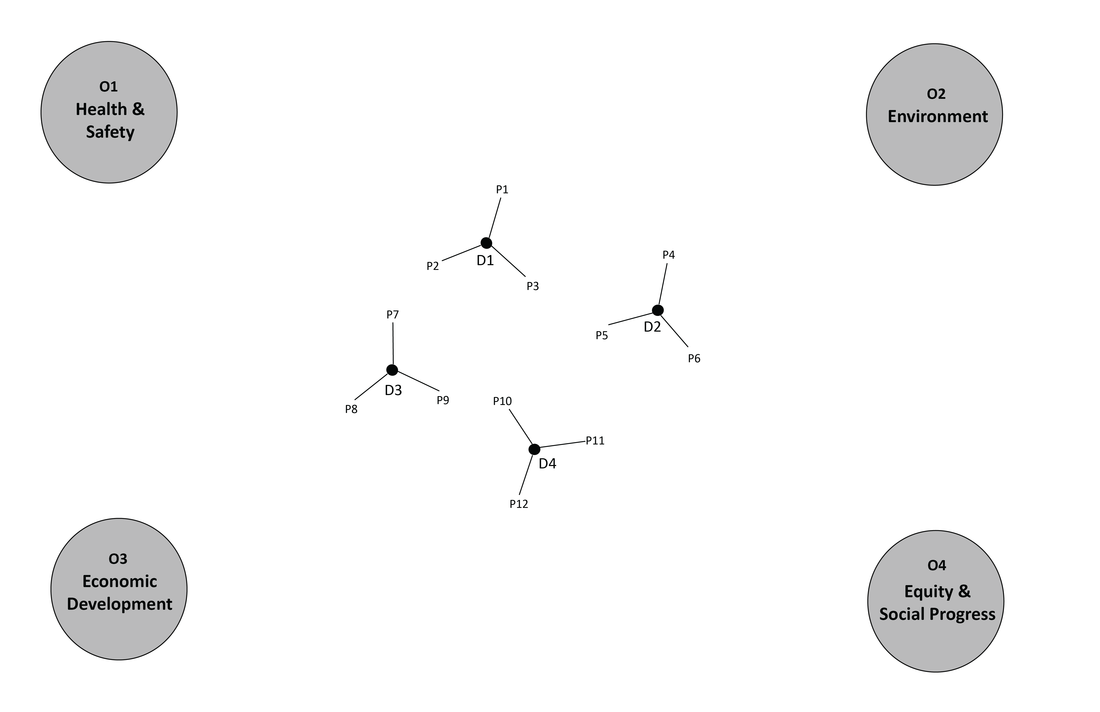
Figure B
Fourth, you’ll begin detailing the map for a specific program or initiative. Let’s take an organization that works on housing needs, and potentially other topics, and let’s say they have an initiative to analyze population projections and the current housing stock in order to estimate the amount of housing needed for the future. They may work on the regional or metro area wide scale and share this information with local governments, or they may be on the local government level and use it for their internal purposes. It influences zoning, incentives for housing development (on state and federal levels), and communication with real estate developers on the level of need. Three staff members work on this initiative, and it is called “a place to call home, now and in the future.” 
 
Mapping your first program
Now, let’s map “a place to call home, now and in the future” as if you are one of the staff members (see Figure C). The first outcome you think is already strongly connected is economic development. There have been new employers in the area and existing employers scaling up their operations, all with implications for housing employees. You jot down a description to that effect and title it “employee housing” to reflect an anticipated result (AR) of the program. Note that you can read more about “anticipated results” in How to Combine Mapping and Results for Holistic Organizations as well as in the section below. Next, you draw a line to the environmental outcome. This one is about the density of housing. It turns out the new housing proposed would be at a higher density than in the past, using land more efficiently. You title this AR connection “higher density housing.” Another thought comes to mind; can the utility providers keep up with higher density areas? You make a note to speak with utility organizations, water, gas, electricity, and internet service providers, to understand if there are limitations to take into account. Below the AR, a question (Q) is mentioned, “utility feasibility & sustainability.”

​Another line is drawn to the environmental outcome to highlight that the housing is planned to be transit connected for access to employment and commercial centers. This AR is titled “transit connectivity.” This item sparks a related thought. On past projects, sometimes the transit-connected neighborhoods end up being in such high demand that property values increase and rents rise, which leads to long-time residents moving from the area (i.e., geographic displacement/gentrification). A dashed line is drawn from the “transit connectivity” AR over to the equity and social progress outcome and is titled “plan for potential displacement,” which is labeled as a need (N). In addition, “transit connectivity for all” is added to reflect the need (N) for all income and housing groups to benefit. You wonder if there are protective policies to put in place early on in the effort to counteract this trend, should it occur. After thinking more about equity, you realize that no formal recommendations have been made regarding the balance of housing for various income levels, though it has been discussed. You decide more work is needed in this area and label the need (N) with a dashed line “plan for balanced, attainable, and affordable housing.” Along the same connection, “plan housing options for disability and older age” as an N is added. 
Picture
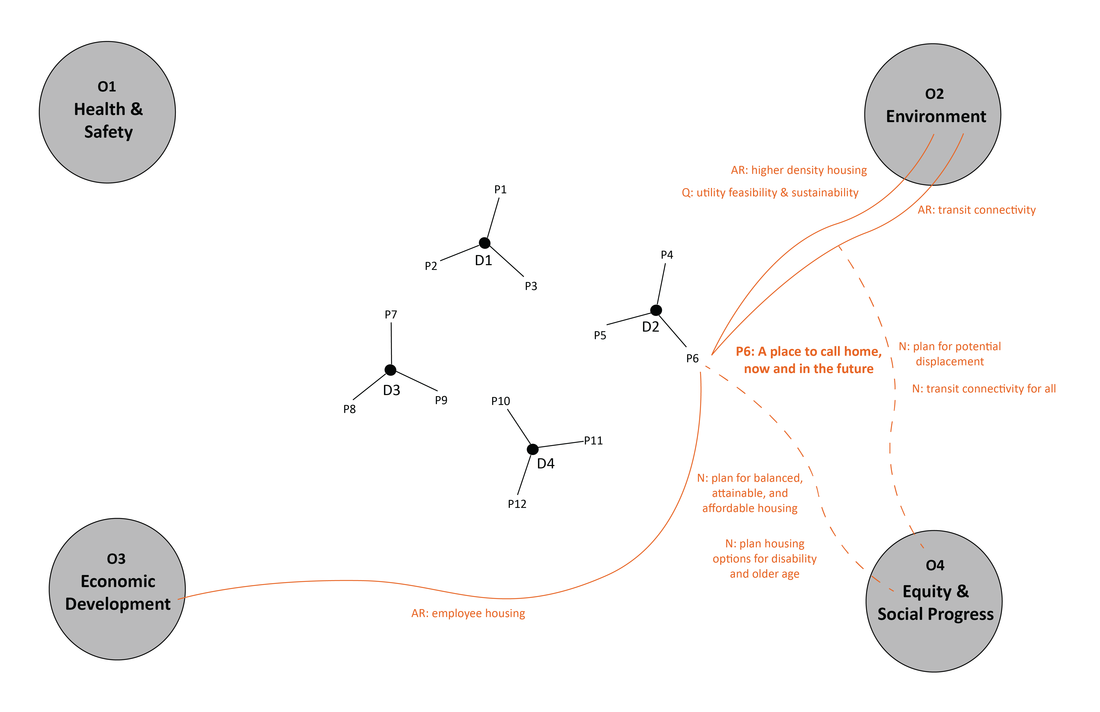
Figure C
Mapping your second program
The next program you tackle is the bicycle and pedestrian planning and implementation program. It is called “Getting place to place by bike and on foot” (see Figure D). The first line is drawn to the health outcome and titled “exercise during transportation” to describe the role of active transportation options in gaining more exercise, improving overall health, and reducing the likelihood for obesity and related health conditions as an AR. The next line is drawn to the environmental outcome and titled “environmentally friendly transportation options” to address the fact that these options have no related pollutants that impact air quality and climate change as an AR. A dashed line is drawn to equity with the title “plan for bike/ped improvements for all income levels.” In some of the lower income neighborhoods, it is well known that the bike and ped infrastructure is in worse condition than the wealthier neighborhoods; planning for this is an N. Another dashed line connects to the economic development outcome with the title “plan for understanding bike/ped benefits to the economy.” You are confident there is a connection, but not sure what it is exactly. You plan to address this later, also an N. 
Picture
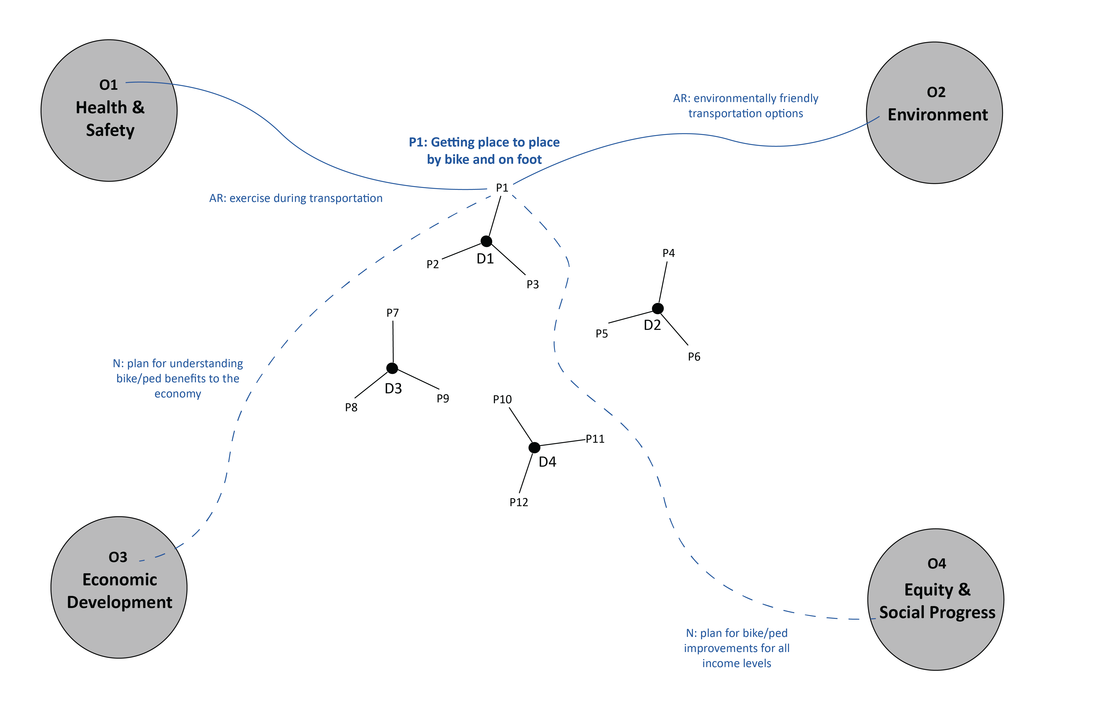
Figure D
Anticipated results, needs, and questions
You see how the map begins to form and take shape. After building out all the layers and comparing them to each other, it becomes clear where the current concentrations of anticipated results (AR) are, in connection with outcomes, as well as where gaps are reflected as needs (N). The ARs provide clear targets, which can be coupled with more detailed qualitative and quantitative measurement of specific tactics, to help compare and contrast different aspects of the program according how they “score." This enables clear target setting through a methodical systems-wide approach. An AR accompanied with a question (Q) let’s you know that more research is needed. While the AR may be a good target, there could be some underlying issue that needs to be better understood. A need (N) identifies something that is crucial to a specific issue that is currently lacking. This means that while a general connection with the outcome is clear, the actual AR that connects the program with the outcome is not defined yet. A separate analysis should be undertaken to identify the ARs to pursue; you ultimately want to convert each N to an AR or multiple ARs. You can see both programs mapped together (see Figure E). 
Picture
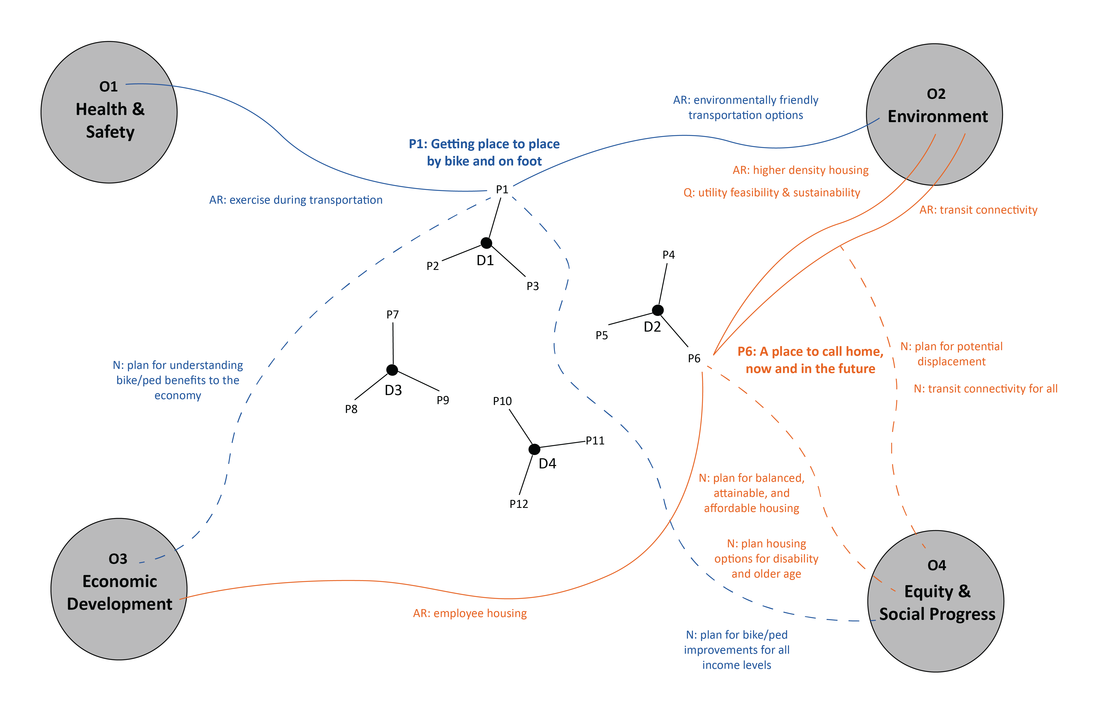
Figure E
How you could use these insights
Once the drafts have been created, if working with pen and paper, one big map can be created to get a full view. If working in software, all the layers can be shown at once with adjustments to individual layers, allowing the full view to be shown at one time. As the map gets built, outcome subcategories start to form to further define the outcomes. How this information is used can be wide ranging, but here are a few options:
  1. Collaborative work sessions - An executive could hold sessions with other staff members to discuss which elements they agree with or disagree with, so that this initial exercise is only the first iteration. It is recommended that multiple staff members at different levels and with different subject focus areas collaborate on such an effort. This will give a chance for different perspectives to be understood and the map to continue to shape. Having those with different specialties present is critical for identifying a wide range of connections, since this is ultimately an interdisciplinary exercise. 
  2. Getting to and communicating the “why” - Perhaps your organization does not necessarily want to change the way it works, but it does want to be clearer about its mission, purpose, and achievements. This type of exercise can gain insight into precisely that. 
  3. Measuring progress according to outcomes - On the other hand, perhaps your organization does want to change the way it works, at least slightly at first. Before moving into a new way of measuring progress or changing strategy, this type of exercise can help you see how these outcomes might be understood, as a first step, upon which more definitive steps could be added. 
  4. Reorientation of organization according to outcomes - It could be that the organization is structured with meetings, programs, and progress in strict subject-related areas, with limited opportunity for connection. This type of exercise shows some early opportunities for thinking about where some areas already connect fairly well, and where others have serious gaps. 
  5. Collective impact - Some elements will lead to subject or topical areas that fall out of the immediate scope of the organization, but are connected to its progress and mission. In such cases, it makes sense to figure out which organizations do have more influence or control and initiate contact in case of collaboration and a shared way of working. Ultimately, this can provide a foundation for a collective impact approach. 
 
While this article helps you make connections between programs and outcomes, the next article, How to Map for Cross-Functional Areas, will help you make connections between functional areas such as housing, land use, and transportation. These are often the same topics that organizations use to determine organizational structure into programs, divisions, or departments. This can add another optional layer to the outcome method for complementary insights. 

July 23, 2018

7/23/2018


How to Map for Cross-Functional Areas

Although the staff members may be generally aware that these cross-department contributions exist, without mapping them and being as specific as possible, it is impossible to know how all the work across departments builds upon each other in specific ways."
Picture
​For some organizations involved in urban planning and management, it is unclear what their strengths and weaknesses really are. What are they doing very well? Or poorly? What topics have thorough coverage? Or lacking? One way to gain quick insights, which can provide a base for further exploration, is through mapping for cross-functional areas. Keep in mind that How to Map for Outcomes can be combined with cross-functional mapping for a deeper analysis, though each is helpful in its own right. 
 
Mind mapping for cross-functional areas step-by-step
Take a look at How to Map for Outcomes for the basics of mind mapping. We’ll keep the steps the same until we get to the third step. From that article, “First, you’ll start off with the current basis of the organization, typically the departments or divisions of the organization. You’ll map these fairly equidistant from each other to give space around each one. Second, you’ll branch from the departments or divisions with the work they produce. There is a wide variety, of course, but typically these are structured as programs (containing multiple projects and initiatives). Projects are likely at too small a scale to map with this step, unless they have an importance level similar to a program.” 

​Third, instead of mapping outcomes of focus or interest, you’ll map cross-functional areas. Typically, the functional areas (note we are not getting into the cross functional part yet) will be the areas of work or delivery areas of the organization, reflected in the structuring of departments or divisions. Some typical functional areas are emergency management, transportation, workforce, land use, zoning, and housing, and many others (see Figure A). 
Picture
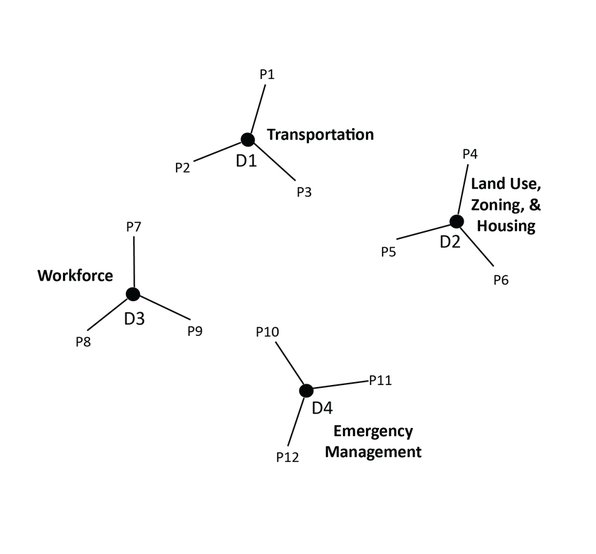
Figure A
When we map cross-functional areas, we make connections between the functional areas, typically structured as departments or divisions. Let’s walk through an example process of someone in an executive position working to pinpoint cross-functional areas. Keep in mind, the lines illustrating connections can come from the department in general or a program or initiative that has been identified. For this example, we’ll focus on the department level, but both levels could be included and will reap greater and more accurate detail. The organization does a good bit of work on protecting key critical infrastructure elements for the purpose of emergency management, such as ensuring evacuation routes are the last infrastructure elements to fall into a state of disrepair or levees and other protective infrastructure are the first to receive maintenance funds. Some of these critical infrastructure elements are for transportation purposes, so a line is drawn from emergency management to transportation with the anticipated result (AR) title “critical transportation infrastructure protection.”

​Shifting into the land use, zoning, and housing department, the work they do in housing involves a connection with transportation. Housing is planned with multi-model connections including transit, biking, walking, and driving to employment, commercial centers, and other key destinations. This AR connection is titled “housing development with balanced transportation access.” In thinking more about housing, some gaps come to mind. Housing is of course tied to workforce development, but there is not a clear connection the organization makes between these two currently. A dashed line for a need (N) is drawn with the title “plan for balanced workforce housing.” That is a big topic that could take many directions. It could pertain to ensuring housing is balanced, attainable, and affordable to all income groups for existing employers as well as new employers that recently moved to the area. It could tie into other needs as well. Housing is currently not a major focus for the emergency management work, though it could be strengthened. A dashed line is drawn with the N title “pinpoint housing needs within emergency management.”  Another AR between workforce and transportation is “transportation with balanced workforce access,” and another N between workforce and emergency management is “plan for post-disaster workforce recovery.”
Picture
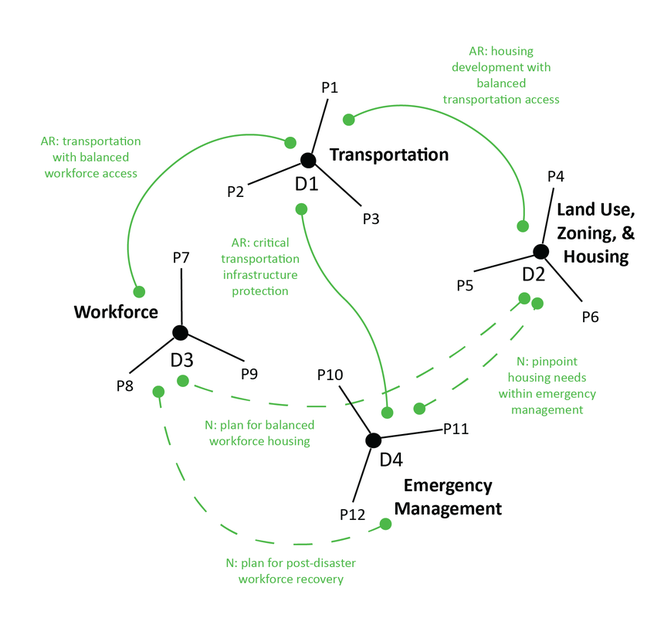
Quick way to understand work across departments 
As the exercise proceeds, the filled AR lines begin to indicate where the current efforts are, while the dashed N lines indicate potential gaps. Though rudimentary, it is quick and easy to do by only one staff member as a start and is truly telling of the work products and their ultimate contribution areas. Although the staff members may be generally aware that these cross-department contributions exist, without mapping them and being as specific as possible, it is impossible to know how all the work across departments builds upon each other in specific ways.

How you could use these insights
As with How to Map for Outcomes, how this information is used can be wide ranging, but here are a few options:
  1. Collaborative work sessions (same as with outcome mapping) - The executive could hold sessions to other staff members to discuss which elements they agree with or disagree with, so that this initial exercise is only the first iteration. It is recommended that multiple staff members at different levels and with different subject focus areas do collaborate on such an effort. This will give a chance for different perspectives to be understood and the map to continue to shape. Having those with different subjects of focus and specialties is critical for identifying a wide range of connections, since this is ultimately an interdisciplinary exercise. 
  2. Getting to and communicating the organization’s true, current focus - Organizations sometimes do a lot of things and take on increasingly wide ranging work. Not being clear about the core of the work runs the risk of stretching the organization too thin. From a communications perspective, it can also make it seem as if the organization does a little bit for everyone and everything, which can create the perception that it does very little overall. Sometimes it can be better to go narrow and deep than thin and shallow. 
  3. Finding and bolstering strengths - After the true and current focus becomes clear, the organization may wish to simply bolster in the direction it was already heading, which can be a very effective strategy.
  4. Finding and turning weaknesses into strengths - In some cases, pinpointing the true and current focus reveals significant gaps, which some may have thought were filled, but are not addressed adequately enough to reap real impact. In this case, the exercise builds a base for building up weaknesses. 
  5. Connecting funding with core delivery areas - Some organizations experience fluctuations with funding, and it can be helpful to understand what should always remain protected, no matter what. This type of exercise reveals the special and unique offering of the organization, which should be prioritized in the event of a sudden downturn. 
  6. Uniting planning processes - Some planning processes are separate due to legal requirements and the structure of departments, such as economic development plans and transportation plans. However, in many cases, the result of the planning process (typically a document) is the only element required to be delivered separately, at least from a legal perspective. This means that the separate planning processes can be united into a single process with multiple results or products. This type of exercise can serve as an initial foray into the potential for planning process connectivity. 
  7. Collective impact (same as with outcome mapping) - Some elements will lead to subject or topical areas that fall out of the scope of the organization, but are connected to its progress and mission. In such cases, it makes sense to figure out which organizations do have more influence or control and initiate contact in case of collaboration and a shared way of working. Ultimately, this can provide a foundation for a collective impact approach.

Now that you have a strong foundation for both cross-functional mapping and outcome mapping, move onto the next step, How to Combine Mapping and Results for Holistic Organizations. In addition, see if other resources can be helpful such as How Operational Level Staff Can Get Involved . 

July 16, 2018

7/16/2018


How Operational Level Staff Can Get Involved

As operational staff, your role is to influence new ways of thinking and doing which may require the acceptance of some members of the managerial or executive staff. On the other hand, you may control a domain that you can exert control over, such as at the program level. You could follow the same exercises and consider improving or restructuring your program according to outcomes or cross-functional areas."
Picture
While the previous articles in the educational article series were explained for the executive and managerial levels, this article leverages the content from the articles but orients it at a different and extremely impactful audience - operational level staff. To that end, make sure to review those articles first as a primer. Operational level staff are those in support functions to executive and managerial staff. They tend to be specialists in a given area and could function as project managers, program managers, and/or analysts. Their roles are wide-ranging and serve any number of functions. 

How to get started horizontally 
As operational staff, your role is to influence new ways of thinking and doing which may require the acceptance of some members of the managerial or executive staff. On the other hand, you may control a domain that you can exert control over, such as at the program level. You could follow the same exercises and consider improving or restructuring your program according to outcomes or cross-functional areas. To do so, you’ll likely end up needing to work horizontally with peers in adjacent programs with connecting functions or outcomes. If you follow these steps, you’ll see there is a way to begin from your own domain.
  1. Complete the exercises - Take a look at the other articles in the series and complete the same exercises with a special vantage point from your work. From there, identify the key takeaways and insights you learned to influence your work domain. 
  2. Identify adjacent peers and hold work sessions - Now that you know the “what,” identify the “who.” Who are the peers in the adjacent areas whose work may also be impacted? Consider those you know to be open-minded and flexible in their thinking, because they may end up being the most receptive. At the same time, don’t dismiss anyone you perceive to think in a certain way. Oftentimes, we perceive people incorrectly. Try and give them a chance, such as chatting informally with them to test the waters. Start off with “I’ve been thinking about this new idea, can I can bounce it off of you? I’d really appreciate your thoughts.” When you treat people with respect and show you truly value their opinion, they tend to respond positively. We instinctively know when we are respected and appreciated, and that fosters being receptive to new ideas from others. Next, think about “how” for the work session. How will you brief them on your thinking to date (feel free to reference the educational article series, of course), and how should the work session be navigated? Perhaps you offer for them to complete an exercise with you. Your group could modify your draft or begin a fresh one from the group perspective. This could easily be done on a flip chart with you as the scribe. There may be other ways you’d like to approach the work session; be open to a variety of ways to have this discussion with your peers. 
  3. Implement new ways of working - By the end of the work session, you should land on a few new ways of working. Once you put them into action, keep each other updated. This can be as simple as sending a follow-up email after the work session with the items you each agreed to do and the timeline. Then, each time you reach a new step, send a quick email to all saying, “Hey, I did this, and this is how it went. I'll keep you posted!” The same can be done during staff meetings, if you happen to be together. Be an example of keeping people in the loop, and it is more likely they will do the same. 
  4. Test and refine - Don’t let your new ways of working remain stagnant. Sometimes they’ll go great, other times, not so much. That is just the way it goes. Check in on how it goes to remove or adapt what does not go well, and build up what does go well. You’ll then make this a creative learning process, which is exactly what it should be. It is not about being right or wrong; it is about thinking differently and learning by doing. 
Picture

Working with managerial or executive staff vertically
Let’s say you don’t control a certain domain, or you do, but believe any changes or improvements you’d like to make require acceptance of some members of the managerial or executive staff. This involves another set of steps.
  1. Gain clarity on what you’d like to pursue - After completing the exercises through the lens of your work, consider what your first steps should be and be very clear about them. You may have learned a lot in the process, but you’ll need to start at a key point and work outwards.
  2. Strategize who to speak with and what to say - You may have existing relationships to leverage or a staff member who you think would be receptive. Consider who this might be and initiate contact.
  3. Discuss in-person and identify paths forward - Set up a time to speak with them, and feel free to reference these articles to give yourself a base. Explain why you think the changes are important and how you suggest they might be implemented. Don’t go too far without gaining their feedback first. Let them respond and share their own insights to make it a true dialogue. 
  4. Implement new and agreed-upon ways of working - By the end of the meeting, a few ways to move ahead should be identified. Go ahead and get to work on them and update the staff members with interest periodically either in-person or via email.
  5. Test and refine - See “test and refine” above.
 
Keep in mind, you may end up completing both processes, one horizontally (with peers) and another vertically (with management or executives). They are not mutually exclusive, and it could end up that both are needed to a certain extent to institutionalize the changes you identified. The important thing is to keep an open mind, because even in small increments, institutional change can be a long and challenging process. The more convinced you are that the change is important, the more drive you’ll have to collaborate and convince your way to new way of working and doing. 

July 9, 2018

7/9/2018


How to Combine Mapping and
​Results for Holistic Organizations

What if an organization forges ahead with 'what' to measure without spending enough analytical time and energy on 'why' they are measuring in the first place? Mapping for outcomes and cross-functional areas helps you understand 'why,' which you can use as a base to explore the specifics of 'what' to measure."
Picture
Mapping for outcomes and cross-functional areas combined
How to Map for Outcomes and How to Map for Cross-Functional Areas can be combined to become a 2-part mind map. Keep in mind, the two don’t necessarily need to be used together to be useful. You can certainly find benefits from applying either mapping for outcomes or mapping for cross-functional areas. It all depends on the type of project that you have and what types of silos are the most problematic for your strategy, tactics, and operations. 

Creating a 2-part mind map implies that your organization wants to work on both the department or division level for the connections between them, and that it also wants to connect its work more concretely to system-wide contributions through outcomes. I’ll cover a few more concepts below to connect some remaining dots, and then I’ll explain how to shift from a 2-part mind map to a 3-level approach. 
Picture
Potential applications
In the “how is it useful” section of Getting Started with 360 Degree Planning, a number of potential applications were mentioned. “Executives and managers often work on strategic plans to set the tone, vision, and priorities of the agency. They may also track their performance and progress according to performance measurement systems for monitoring and evaluation purposes. They may be considering reorganization, but are unsure where to begin or what logic a new organizational pattern should follow. This series can help with all of that and more.” The word "measurement" came up, as it often does when talking about urban planning and management. We all know the phrases “what gets measured matters” and “what gets measured gets managed.” What if an organization forges ahead with “what” to measure without spending enough analytical time and energy on “why” they are measuring in the first place? Mapping for outcomes and cross-functional areas will help you understand “why”, which you can use as a base to explore the specifics of "what" to measure. 
 
Origin of "outcomes"
Sustainable development is most commonly defined as "development that meets the needs of the present without compromising the ability of future generations to meet their own needs." This definition is taken from Our Common Future, also known as the Bruntland Report, published in 1987. As the International Institute for Sustainable Development explains, this document provides the most common definition and overarching concept for sustainable development that is still in use today. Since I am a fan of all things graphic, I’ll share below an excellent graphic that gets the point across quickly and shows the points of intersection clearly. Sustainability is broken into three primary areas, environmental, social, and economic. At the intersections are socio-environmental, eco-economy, and socio-economic areas. Of course, the center is where all the concepts come together. Though there are slight variations, this is the most widely applied sustainable development concept in use in the international urban planning and management field today.
Picture
“Key elements of sustainable development” figure from “Measuring Objective Well-Being and Sustainable Development Management” by Anita Freimann, Marija Ham, and Josipa Mijoč. https://www.researchgate.net/figure/Key-elements-of-sustainable-development-Source-Verify-sustainability-8_fig2_263558369
The use of “outcomes” is an expression of sustainable development concepts. I have four that I commonly reference - economic development, equity and social progress, health and safety, and environment. This is essentially a translation of the primary 3 with an extra focus on health and safety, which is built into each one to a certain extent. I choose to bring it into its own area for emphasis. Each professional may focus on different areas, depending on their organization, program, and project needs.

There is a concept that is also commonly applied, which runs in parallel to sustainable development – the “triple bottom line.” This concept emerged in the business field, and John Elkington claims to have coined it in 1994. It seems to be a business-friendly translation of sustainable development shared above. It was essentially a call for businesses to not think and act only in economic or financial terms, but to consider the broader societal impacts of their work. As the Economist put it, “It consists of three Ps: profit, people and planet.” I find it immensely intriguing when neighboring concepts show up in different fields; it shows us how even in a common language, English in this case, there is a need for technical translation between fields of work and study. If anything, it is proof of how helpful the concept is for describing the need for a holistic approach, whether our work is on cities or in business. 

Anticipated vs. proven results
There are anticipated results (AR), those we aim to achieve, and proven results (PR), those shown to have been reached. The articles in this series focus on AR, because we are establishing these targets through the process. AR vs. PR separates the target setting from the achievement. The important thing to keep in mind about target setting through anticipated results is that you are starting with the end in mind first, so that you can build towards it. 
 
Some connections have been identified as “needs” (N). These are gaps in potential ARs. Each N should be reviewed and prioritized to judge if the need should be addressed, which means more deeply understood and eventually converted to one or more related ARs. On the other hand, if it is considered a low priority, it may need to be abandoned. In addition, there are questions (Q). These pertain to ARs that are nearly there, but are unresolved or have a significant caveat. Before fully accepting an AR with a question, the answer should be obtained. 

Results through 3-level approach
Consider a 3-level approach to establishing holistic anticipated results. Level 1 is functional, pertaining to delivery targets core to the mission, such as "timely, efficient, and reliable trash and recycling collection." Level 2 is cross-functional, pertaining to the ARs identified such as “housing development with balanced transportation access.” Level 3 is outcome-based pertaining to the ARs identified such as “exercise during transportation.” With these 3 levels, you are going from the smallest unit to a cross-unit analysis to, finally, a higher level, bird’s eye view of their reach into quality of life issues. By taking all the ARs across all 3 levels, you’ll have a clear picture of the targets you want to achieve. Of course, they are not all equal, and a prioritization exercise could help. One of the exciting steps involved with the 3-level approach is that you can get into spreadsheets. For some, spending time in the systems thinking and mind mapping space can be exhausting, and they feel more comfortable using spreadsheets. Though this process, you can see that systems and linear thinking patterns are not at odds with one another; they are complementary. 
Picture
Understanding your organization’s impact and collective impact​
The impact your organization makes is the combination of proven results across the three levels – functional, cross-functional, and outcome-based. Each level is important in its own right, but it is the combination of all three that holds real power for exponential impact. Once you have the 3-layers that are internal to the organization, you can then begin to try and see your organization within the larger system, including its relationships with other organizations. This level is where collective impact is applicable. Impact works best when it is understood in combination with the efforts of others. The collective impact model is an excellent way to think of how all this work combines to meet needs spanning any single organization, which the majority of urban issues do. While you may be able to reach a target, or a PR, you may find that an outside force dampens its effect, or that it could be strengthened when taken into account with the actions of other organizations.

Check out How Operational Level Staff Can Get Involved ​to complete this educational article series. 

July 2, 2018

7/2/2018


Educational Article Series:
Getting Started with Real Time Planning

How can we hope to build resilient cities, when the processes that govern cities are not resilient?"
Picture
What is it?
Real Time Planning involves improving planning processes to ensure that they are kept up to date. It entails identifying elements of the planning process that hinder this goal and fixing them, such as identifying elements subject to change and specifying the ways in which they might change over the years. It enables plans to be kept current, avoiding the pitfall of outdated plans with past information that is no longer relevant.
 
Real Time Planning works from the broadest strategic scale down to the narrowest project scale to dissect and identify why certain decisions are made, the fundamental elements of the decision, and how that decision might change over the years. This can be a great help to capital planning, programming, and budgeting to keep decisions as flexible and responsive as possible.
 
For whom is it?
Any urban planning and management professional at executive, managerial, and operational levels can apply Real Time Planning. It is best suited to professionals who ask themselves questions such as, why are we relying on a 5 year plan document, when we know that by year 3 the recommendations and projects will be out of date? Why are we “remaking” the plan every 5 years and losing the continuity and progress measurement of the last plan, as opposed to refreshing the plan? With the rate of change these days, why do we have a plan document that is frozen at one point in time without tools to update it between year 1 and year 5? 
Picture
How is it useful?
Urban planning and management professionals put an incredible amount of time, energy, skill, and thought into each planning process and document. By switching our mindsets and actions to a place of flexibility, rather than rigidity, we do the profession and the places we lead a service. The world is moving too quickly to pretend that what was decided 3 years ago still holds true. It often does not. 
 
Real Time Planning helps professionals with small changes that add up to a big difference. By applying a few rules of thumb, even an already existing planning process can add in elements to become more flexible and responsive. In terms of day-to-day work, this means that plans can be updated with ease, consultants do not necessarily need to be involved each time, and professionals have the peace of mind that they are operating on the best, current information. In the big picture, our cities will become more responsive to change, uncertainty, and unknowns as a result. In this day and age, this is sorely needed.
 
How can we hope to build resilient cities, when the processes that govern cities are not resilient? 
Picture
What are the articles in the series?
Background
  • Why is real time planning needed to navigate urban change? This article serves as a primer on the state and pace of change while calling for more structure and transparency for planning and decision-making processes. It closes with an explanation of why solutions are needed.
​Instruction and Guidance
  • How to apply a 10-point checklist for future-proofing your plan - This article breaks down a real time planning approach into 10 checklist items to apply to existing planning processes. You can quickly see if your process has these elements, and if not, identify gaps in adaptive planning to address later. 
  • How to identify tipping points and triggers - Tipping points and triggers are the indicators that tell us a possible future event is occurring in real time. This article gives examples of what they are and how a plan could leverage a set of tipping points and triggers as an alarm system of sorts to put responsive projects in place. 
What's Next
  • Email me to share your thoughts and questions. I'd enjoy hearing about your work and would like to help.

    Author

    Janae Futrell, AICP, LEED AP

    Archives

    September 2018
    August 2018
    July 2018
    June 2018

    Categories

    All
    360 Degree Planning
    Real Time Planning
    Tech Savvy Planning

Logo for Civic Sphere.
Contact: [email protected]
© COPYRIGHT 2025. ALL RIGHTS RESERVED.
  • Home
  • Projects
    • Accessible Transportation
    • Service Models
    • Tech Maximization
    • New Concepts
  • Clients & Partners
  • About